

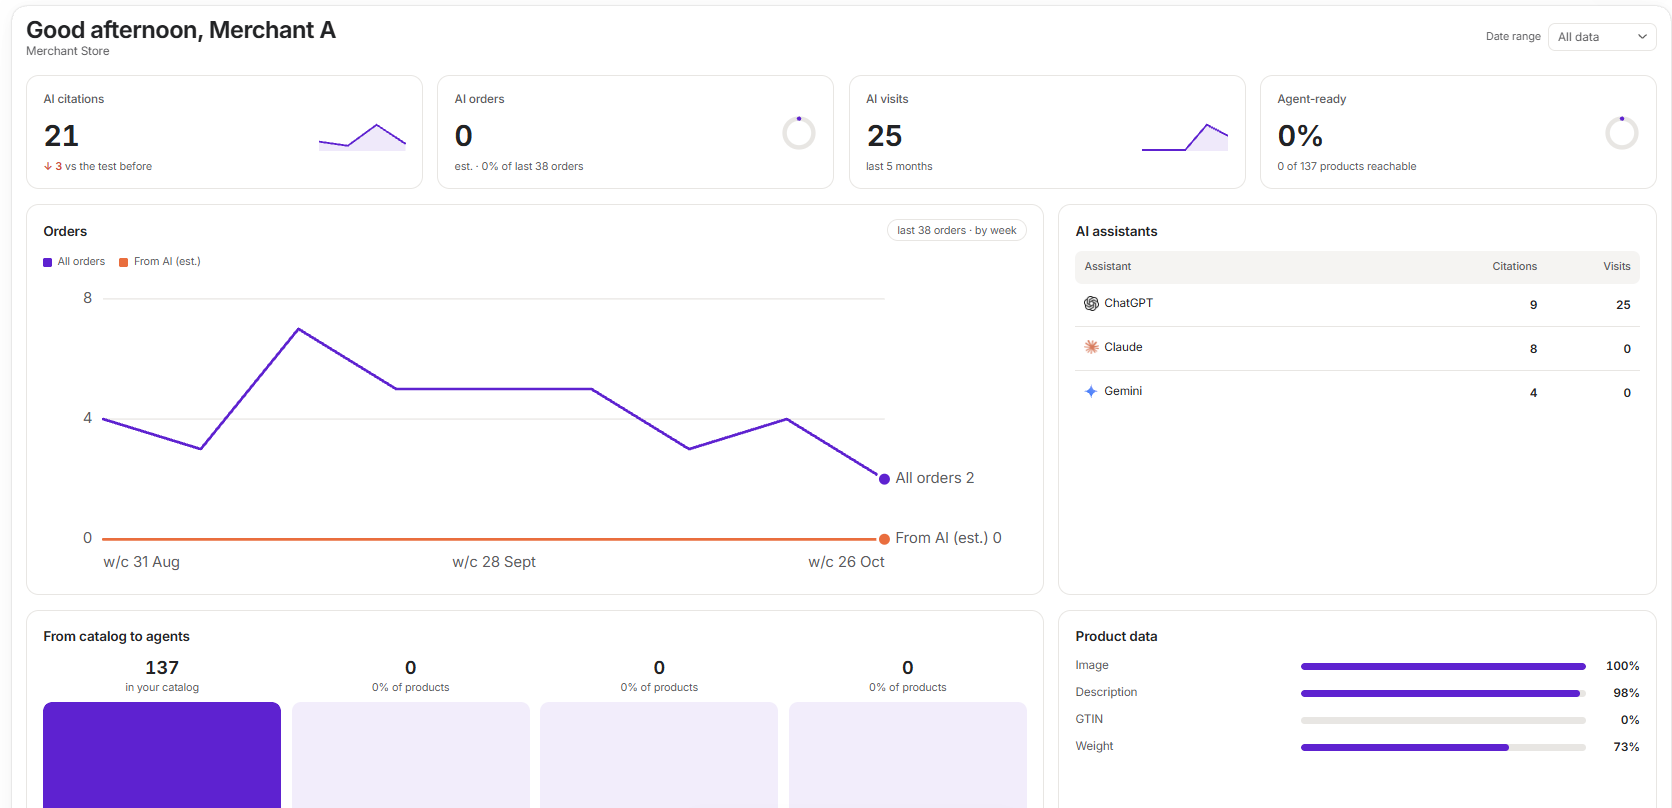
The date range
Use Date range at the top right to choose All data, Last 7 days, Last 30 days or Last 60 days. It changes citations, orders and Google Analytics figures. Cards about your catalog show today’s state, so they don’t change.All data has limits. Orders cover the last 60 days and up to your latest 100 orders. Google Analytics covers the last 5 months.
The tiles
The cards
- Orders: all orders against those estimated to be from AI.
- AI assistants: citations and visits for each assistant.
- From catalog to agents: how many products are in your catalog, reachable, passing every check and in feeds, with each as a share of your products.
- Product data: the share of products with an image and a description. GTIN and weight are measured against physical products only.
- Where you stand: a list of checks, with links to fix them in Shopify.
AI referrals
Scroll down for AI referrals. It measures assistant traffic in two ways:- How orders arrived: read from your Shopify orders. This needs nothing connected.
- Who clicked through from an answer: read from Google Analytics. This shows sessions, purchases, revenue, how that traffic compares with the rest of your store, and the pages assistants send shoppers to.